


INTRODUCTION
First documented by Hewitson-Brown in 1937 in a patient with alopecia areata, pigmented paravenous retinochoroidal atrophy remains a rare and enigmatic retinal disorder.1 Over time, the descriptive term has gained widespread acceptance, encapsulating the evolving understanding of this condition. Patients often remain asymptomatic or present with only mild visual disturbances, making its striking fundus appearance—marked by characteristic spiculated pigmentation and chorioretinal atrophy—the first clue to its diagnosis.2–4 Despite its rarity, patients presenting with this condition continue to intrigue clinicians and researchers, highlighting the need for advanced imaging and diagnostic approaches to unravel its presentation and lead to understanding of pathophysiology. No identifiable health information was included in this case report.

CASE REPORT
A 20-year-old Hispanic individual, assigned female at birth, presented for a routine eye examination with a chief complaint of mild bilateral blurred vision. Additionally, she reported experiencing intermittent peripheral flashing lights in both eyes at night, particularly when transitioning from light to dark, for the past 2 months. Her last eye examination was 5 years prior, during which she was advised to follow up for further evaluation of an unspecified retinal finding but failed to comply. She had no history of ocular inflammation, trauma, nyctalopia, or a family history of retinal disease. Her systemic health history was unremarkable, aside from a family history of metabolic syndrome. She was a nonsmoker, did not consume alcohol, and was not taking any medications, including over-the-counter agents.
On examination, best corrected visual acuity was 20/20 in both eyes. Color vision (Ishihara), stereopsis (Randot), Hirschberg alignment, extraocular motility, pupils, confrontation visual fields, slit lamp evaluation, and intraocular pressure were all within normal limits. Dilated fundus examination was most notable for spiculated pigmentary changes along the retinal veins, accompanied by variable chorioretinal atrophy extending from the optic disc to the equatorial retina in both eyes (Figure 1).

Given the clinical findings, differential diagnoses included chorioretinal degenerations, infectious or inflammatory diseases, retinitis pigmentosa, pigmented paravenous retinochoroidal atrophy, and other pseudo–retinitis pigmentosa conditions. To further evaluate and document the patient’s condition, a comprehensive multimodal imaging and diagnostic workup was conducted, including fundus photography, Humphrey Visual Field 30-2, optical coherence tomography, optical coherence tomography–angiography, fundus autofluorescence, electroretinography, laboratory testing, and genetic testing. A retinal consultation was also obtained for additional evaluation and long-term management planning. No additional workup or treatment was recommended by retina.
Review of Multimodal Imaging
Photography: The extent, distribution, and asymmetry of the paravenous pigment and adjacent chorioretinal atrophy was best visualized with ultrawidefield fundus photography (Figure 1). The pigmentation was more notable in the right eye as compared with the left (green arrows). It began in the posterior pole (albeit some distance from the optic nerve) and extended toward the periphery in both eyes. The pigment and atrophy were perivenular in nature. Additionally, noticeable areas of increased retinal sheen (the pink arrow) were noted in conjunction with the areas of coarse pigment clumping. The unaffected areas of the retina appeared normal on funduscopic evaluation. Unlike other causes of spiculated retinal pigmentation, the optic nerve remained unremarkable and void of waxy pallor or atrophy.
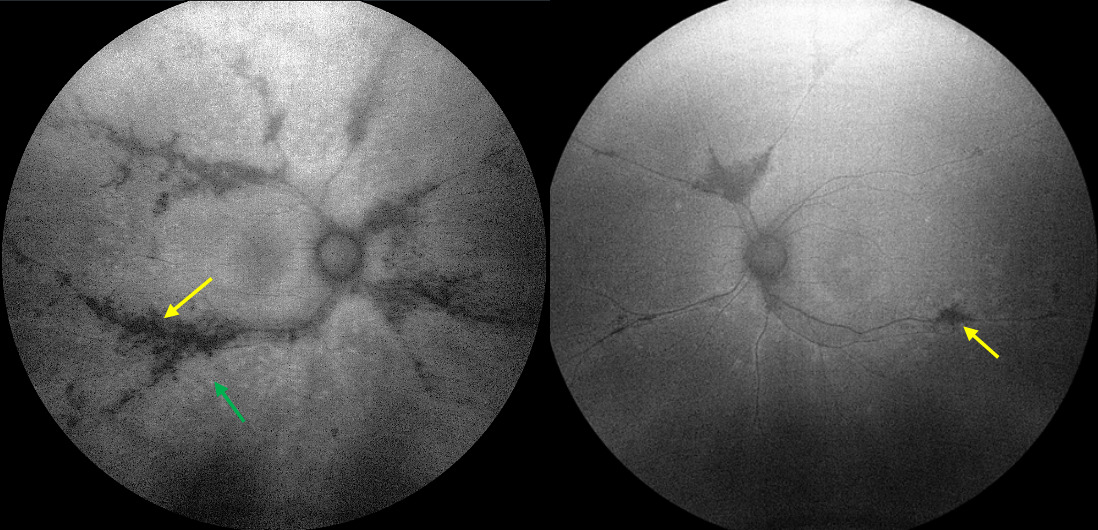
Fundus autofluorescence: Though the asymmetric presentation of the retinal findings was evident on white light fundus view (Figure 1), fundus autofluorescence was able to further highlight the marked difference between the two eyes. Figure 2 shows clear perivenous areas of geographic hypofluorescence (yellow arrows), which signify areas of retinal pigmented epithelium loss correlating with the pigment but that extend past the pigment noted on fundus examination. Additionally, subtle surrounding regions of hyperfluorescence at the edges of these hypofluorescent zones indicate areas of lipofuscin accumulation and retinal pigmented epithelium dysfunction (green arrow), proposing areas prone for future retinal atrophy. As such, fundus autofluorescence is a useful tool in monitoring patients with pigmented paravenous retinochoroidal atrophy for possible progression. These hyperfluorescent areas were markedly worse in the right eye as compared with the left and correlated well with the patient’s functional testing. Fundus autofluorescence revealed the extent of the neurosensory dysfunction, which exceeded the dimensions predicted by conventional examination.3,5 Given macular sparing, severe deterioration of vision was not anticipated.
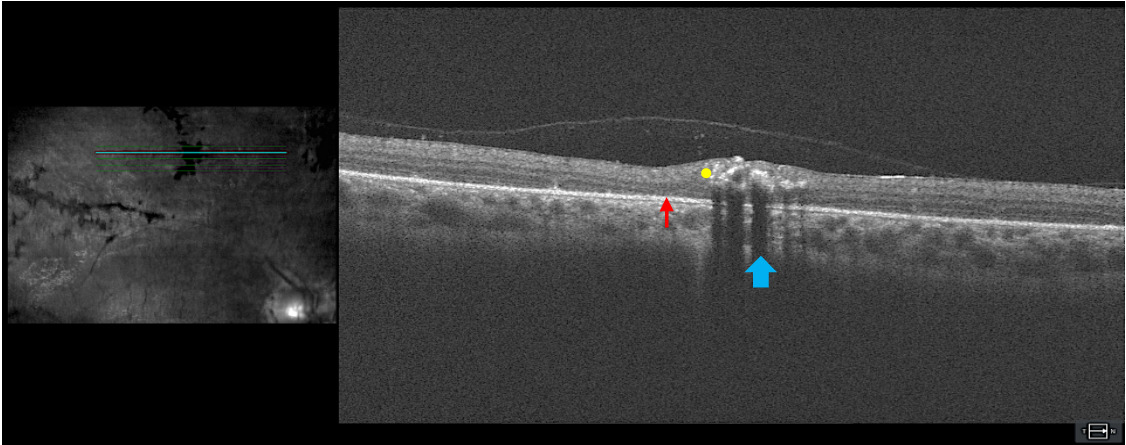
Optical coherence tomography: Figure 3 includes a high-definition 5-line raster through an area of perivenular pigment clumping and atrophy. Hyperreflectivity from retinal pigment (yellow dot) can be seen in the neurosensory retina with shadowing of deeper retinal layers (blue arrow). An epiretinal membrane can be visualized, which correlated with the enhanced retinal sheen seen funduscopically. Increased retina thickness around the abnormality, as compared with the thickness of the adjacent normal retina, was evident. The sub–retinal pigmented epithelium space in the areas of the scan that are not in the shadowed zone appear unremarkable. There were subtle areas of outer retinal layer thinning adjacent to the abnormal pigment (red arrow). The optical coherence tomography imaging indicated that although the retinal pigmentation accumulation was in the inner retinal layers because of the anatomical location of the branches of the central retinal vein, retinal atrophy can be visualized in the adjacent outer retina. This gives insight into presentation of chorioretinal atrophy in the perivenular region.
Optical coherence tomography–angiography: Figure 4 qualitatively indicates a generalized decreased perfusion of the superficial and deep capillary plexi. This appears as marked hyporeflectivity of the general image as compared with normal. Although not readily available commercially, quantitative imaging would be beneficial in determining a superficial/deep capillary plexus density ratio to enumerate changes to perfusion along with monitoring for progression. There have been previous reports of choriocapillaris hypoperfusion noted on optical coherence tomography–angiography, which may correlate with indocyanine green angiography,6 although the latter imaging was not performed in this case. Despite appearing as a flow void (red circle) in the choriocapillaris slab at first glance, the abnormality corresponded to paravascular pigment observed on fundus evaluation and Figure 1. Thus, the region of hyporeflectivity was due to artifact from the blockage of signal by the overlying retinal pigment rather than a true marked area of hypoperfusion in the choriocapillaris.

Humphrey visual field: The 30-2 Humphrey visual field (Figure 5) correlated well with the structural changes best noted on fundus autofluorescence (Figure 3). There was marked functional deficit in the right eye as compared with the left, which followed the pattern of hypofluorescence noted on fundus autofluorescence (Figure 3) more closely than pigmentation alone as noted on fundus evaluation (Figure 1). The functional defect can be quantified using the visual field index, mean deviation, and pattern deviation, all of which are significantly reduced in the right eye as compared with left. The testing appeared reliable for both eyes though it is suggested by the increased test duration and relatively unsteady gaze tracking in the right eye that the patient may have experienced more difficulty with testing in the significantly affected eye. It is important to note that full-field visual field testing is more appropriate for monitoring diffuse retinal degenerations and should be considered in cases like these.

Electroretinography: The full field electroretinography, both photopic light adapted and 30 Hz flicker electroretinographies (Figure 6), revealed normal-appearing waveforms in each eye. The amplitudes for the left eye were significantly greater than those for the right for both conditions (eg, photopic b wave 111.4uV right eye vs 66.67uV left eye). In addition, the implicit times were delayed in the right eye compared with the left eye. The dark-adapted electroretinographies also exhibited normal-appearing but asymmetric waveforms with amplitudes in the left eye significantly greater than those in the right (eg, 147.4 uV right eyevs 39.65 uV left eye). The multifocal ERG, (not shown here), similarly demonstrated asymmetry in favor of the left eye. These findings correlated to structural and functional testing performed with results being more affected in the right eye as compared with the left. Repeat testing was recommended in 6 to 12 months to monitor for changes not related to our presumed diagnosis at the time.
_and_left_eye_(bottom_row)_for_.png)
Genetic Testing
INVITAE Inherited Retinal Disorders Panel (293) was ordered on this patient through INVITAE Diagnostic Testing. This diagnostic test evaluates 293 genes for variants (genetic changes) that are associated with inherited retinal disorders. Diagnostic genetic testing for inherited retinal disorders should be combined with family history, laboratory results, and clinical findings. Information provided by the test results may clarify individual risk and support or rule out other similar clinical diagnoses.7
The test did not identify any pathogenic variants but included variants of uncertain significance that are not completely understood in literature at this time. As more research is done, variants of uncertain significance can be confirmed as pathogenic and identified for future personalized treatment options regarding gene therapy and appropriate management of these disorders.7,8
Laboratory Testing
Laboratory workup included the following: complete blood cell count with differentials, erythrocyte sedimentation rate, C-reactive protein, QuantiFERON-TB, fluorescent treponemal antibody absorption test, rapid plasma reagin, herpes simplex virus 1 and 2 immunoglobulin M screen, angiotensin converting enzyme, and antinuclear antibody. The panel was selected to rule out inflammatory or infectious etiologies. Results were negative for all testing, thus effectively ruling out active infectious or inflammatory processes leading to the retinal presentation.
DISCUSSION
Visual acuity in most patients with pigmented paravenous retinochoroidal atrophy remains relatively preserved; however, cases with macular involvement have poorer visual prognosis. Patients with more advanced retinal changes may report halos around lights, photopsia, nyctalopia, and reductions in both central and peripheral vision. The disease is generally nonprogressive or slowly progressive, with some patients exhibiting gradual enlargement of retinochoroidal atrophy and progressive darkening and widening of perivascular pigmentation.9,10
Anterior segment and vitreous examinations typically do not reveal significant abnormalities in affected patients. Color vision is usually unaffected, although nonspecific dyschromatopsia or acquired color defects have been documented in the literature.3 Fundus findings are predominantly bilateral, with severity ranging from mild to extensive retinal changes. Classic features include bone spicule-like pigmentation along the retinal veins within the vascular arcades, peripapillary pigmentary alterations, and atrophy with thinning of the choriocapillaris and choroid. Perivenular pigmentary changes may present as pigment clumps, bone spicules, or fine pigment dispersion, typically originating at the optic disc and extending toward the midperiphery.3,4,11
The primary histopathologic change suggested is atrophy of the retinal pigmented epithelium and choriocapillaris, accompanied by pigmentation abnormalities.3 Retinal pigmented epithelium atrophy is characterized by the loss of photoreceptor outer segments, outer nuclear layer, and inner nuclear layer, as well as the degeneration of the underlying choroidal vasculature.12,13 Despite these changes, the optic discs and retinal vessel caliber typically remain normal, differentiating the condition further from retinitis pigmentosa.
Multiple etiological hypotheses have been proposed, including sporadic, hereditary, and post-inflammatory mechanisms, with the characteristic retinal findings developing gradually over time.14 Other proposed causes include degenerative, developmental, or vascular origins. Infectious and inflammatory conditions, such as tuberculosis, syphilis, toxoplasmosis, measles, rubella, and sarcoidosis, have also been considered as potential contributors.15,16
Although laboratory testing should be tailored to the individual patient, commonly ordered tests may include the following4:
-
Chest x-ray
-
Complete blood cell count with differential
-
Serum electrolytes and serum protein electrophoresis
-
Erythrocyte sedimentation rate and C-reactive protein
-
Tuberculin skin test
-
Antinuclear antibody testing
-
Serologic testing for syphilis, herpes simplex virus 1 and 2, varicella-zoster virus, cytomegalovirus, rubella, measles, and toxoplasmosis
-
Screening for systemic autoimmune diseases, such as systemic lupus erythematosus or rheumatoid arthritis.
Despite these extensive investigations, no definitive systemic disease has been identified as the primary cause. Any associations with prior illnesses appear to be coincidental rather than causative.4
Pigmented paravenous retinochoroidal atrophy has been reported in familial, nonfamilial, and sporadic cases. Its cause remains unknown, but a genetic component remains possible. Four genes have commonly been associated with pigmented paravenous retinochoroidal atrophy: CRB1, HK1, CRX, and RPGRIP1; however, it is important to note that all four genes are also linked to other forms of rod-cone dystrophies.17–20 An autosomal dominant pathogenic variant in the HK1 gene has been identified,17 whereas a heterozygous CRB1 variant of uncertain significance was reported in a family with apparent autosomal dominant inheritance. The CRB1 gene is linked to autosomal recessive retinitis pigmentosa, Coats-like exudative vasculopathy, and Leber congenital amaurosis. A Val162Met variant in CRB1 is associated with the paravenous retinochoroidal atrophy phenotype, potentially altering CRB1 protein function.18,19 Although the mechanism of inheritance remains unclear, identifying genetic associations may allow for earlier detection in at-risk individuals and better genotype-phenotype correlations and can prove useful in differentiating from other disorders with similar presentation.18,20 Current clinical recommendations include screening immediate relatives of patients with a diagnosis of pigmented paravenous retinochoroidal atrophy for ocular findings and potential workup.
Visual fields in pigmented paravenous retinochoroidal atrophy may be normal but often reveal functional loss and scotomas corresponding to atrophic areas. Reported defects include scattered, ring, and paracentral scotomas; quadrant defects; concentric constriction; and enlarged blind spots.3 Electrodiagnostic testing shows variable electroretinography results, from normal to extinguished, and both normal and abnormal electrooculography findings.4 Unlike many inherited retinal dystrophies, this condition often presents with asymmetric electroretinography responses.20,21 Fundus autofluorescence allows for visualization of lipofuscin activity and cell death and correlates best with patient’s functional vision. SD-OCT findings include outer retinal thinning, photoreceptor disruption, outer nuclear layer and inner nucelar layer loss, and irregular retinal pigmented epithelium.13 Enhanced depth optical coherence tomographyimaging allows visualization of choriocapillaris thinning and increased choroidal vessel caliber in affected areas.9,13 Optical coherence tomography–angiography studies suggest choriocapillaris hypoperfusion,6 although recent data indicate deep capillary plexus impairment affecting the ganglion cell complex and ONL.18 Recently, the use of optical coherence tomography–angiography in conjunction with en face optical coherence tomography to visualize hyalocyte morphology and spatial distribution at the vitreoretinal interface of patients with pigmented paravenous retinochoroidal atrophy has been postulated to predict active inflammation.22 At present, regular multimodal imaging and functional testing are recommended every 6 months initially, then annually to monitor for progression.
CONCLUSION
This case highlights a comprehensive diagnostic approach to pigmented paravenous retinochoroidal atrophy, a rare retinal disorder with unknown etiology that may be asymptomatic, nonprogressive, or slowly progressive. A familial genetic component has been observed in isolated cases. Optical coherence tomography and optical coherence tomography–angiography findings suggest retinal pigmented epithelium and outer retinal layer involvement, with choroidal vascular atrophy. Electrodiagnostic testing aids in diagnosing atypical cases. Although no specific treatment exists, a multimodal diagnostic approach, including fundus photography, fundus autofluorescence, optical coherence tomography, optical coherence tomography–angiography, visual field testing, electroretinography, genetic testing, and laboratory workup, enables accurate diagnosis and differentiation from other pigmented retinal pathologies, baseline assessment, and long-term monitoring.
TAKE HOME POINTS
-
Pigmented paravenous retinochoroidal atrophy is a rare, potentially progressive retinal disorder. Genetic testing may be warranted to rule out inherited retinal masqueraders.
-
Multimodal imaging, electrodiagnostic, and laboratory workup are essential for differential diagnosis and monitoring.
-
Although no treatment exists, comprehensive testing helps establish baseline and track disease stability.
ACKNOWLEDGMENTS
Thanks to Erin Kenny, OD, FAAO, for her expertise in reviewing the results from Invitae; Thanks to Elise Ciner, OD, FAAO, for her expertise in performing and interpreting the electrodiagnostic testing.
DISCLOSURES
No funding was received for this study or publication of this article.